
January jewelry sales launched the US jewelry market in a new direction with robust activity. US jewelry sales revenue increased by 10%, marking the greatest year-over-year gain since April 2022. The increase was driven mostly by an 8.3% increase in average spend per item.
This is the fourth straight month of increasing revenue, and the fifth month of rising average pricing. Coupled with a 1.6% increase in unit sales, the US is definitely on an upward path.
Total natural diamond jewelry sales (including loose and finished jewelry) increased 7.7% year on year. Here, too, an increase in average spend per unit resulted in increased revenue. Unit sales increased by 0.7% in January, bucking the trend of declining sales in 2024.
Lab-grown January jewelry continued to expand in terms of total revenue and unit sales. However, the average price declined 13% when compared to January jewelry sales in 2024.
Year-Over-Year Change in Total US Jewelry Market Sales

Finished January Jewelry Sales Up 11%
US total finished jewelry sales revenue improved 11% in January. The sales growth is not a surprise. In the past 12 months, sales declined only three times, indicating that consumers’ interest in jewelry is not abating despite the rise in demand for competing products.
The rise in sales was stimulated by higher consumer spending per item, up nearly 10%. Rings were 50% of sales, with a double-digit rise in demand for fashion rings that included a 15% increase in average price.
US Finished Jewelry Sales Trend

Finished Diamond Jewelry Sales Change Course
As we indicated in our January report, 2024 was a challenging year for the natural diamond market. However, in January, sales of finished jewelry set with natural diamonds increased by 8.4%. Fashion rings drove the demand increase.
After two years of above-average supply of memo goods, memo contracted in January. This is an indication of midstream strength, with vendors feeling less pressure to make a deal at any cost.
Natural Diamond-Set Finished Jewelry Revenue
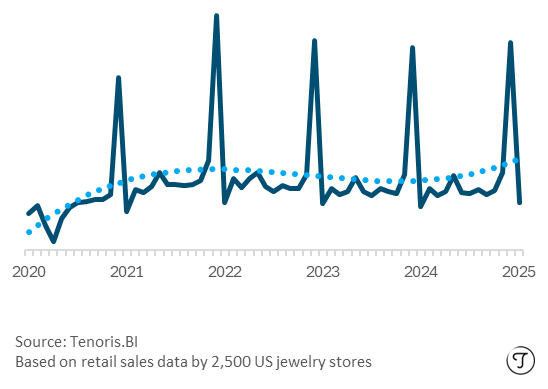
Consumer Demand Drives Finished LGD Jewelry Unit Sales
Lab-grown finished jewelry sales increased 51.5% in unit sales, while the average price fell 8.8%. Despite the price reduction, revenue increased by double digits.
LGD jewelry satisfies consumers’ need to have their diamonds while still paying as little as possible. This is especially true when purchasing diamond engagement rings, which allow purchasers to spend significantly less while outdoing their friends with a larger center stone.
Loose Diamond Sales Recovery
In January, US jewelry retailers increased their total income and unit sales from natural and lab-grown diamonds. This could be early Valentine’s Day sales, but last year, most transactions were made at the last minute, including major purchases on February 14.
Retailers’ Loose Natural Diamond Sales Rise in January
Bucking the long-term trend of diminishing sales, loose natural diamonds set by jewelry shops had a strong start to the year. In January, loose diamond unit sales increased 2.4% year on year, while the average selling price increased 2.2%.
This led to a 4.6% increase in sales for US specialty jewelry retailers.
The persistent interest in bigger diamonds among buyers is one of the factors driving the price growth. Currently, the average is 1.41 carats, up 3% year on year.
US Loose Natural Diamond Sales Trend

Loose Lab-Grown Diamond Trend Keep Steady
January loose LGD sales were pretty consistent with previous years’ averages. Unit sales climbed in the low double-digit range, consistent with the previous two years. Prices fell by another low double-digit figure, extending both the decrease and the rate of deceleration.
Memo items surged in January, accounting for more than half of the loose LGD sold by specialty jewelers.
Demand for marquise-shaped diamonds increased 34% in January, most likely due to Selena Gomez’s recently announced engagement ring featuring the elongated shaped diamond.
US Loose LGD YoY Sales Trend Down

The above high-level figures of the US jewelry market are just the tip of US jewelry market activity we cover. Tenoris has more detailed data that can help improve your business through a better understanding of the US jewelry market. Contact us for a demo.
About Tenoris
Tenoris collects retail sales data from a broad representative sample of US jewelry retailers. Tenoris subscribers include retailers, manufacturers, miners, and financial firms. They use this data to study everything from January jewelry sales and broad market trends to price prediction, assisting them in identifying changing trends and opportunities ahead of their competitors.
Featured photo: freestocks


